
Paradise lost
Who will feature on the common EU blacklist of non-cooperative tax jurisdictions?
Summary
On 5 December 2017, the European Union is scheduled to release its ‘blacklist’ of non-cooperative tax jurisdictions, or tax havens. With pressure building after the release of the ‘Paradise Papers’ for decisive political action, media leaks indicate 53 jurisdictions have been given advance notification that they will be blacklisted unless they promise to change their tax rules. Historically, such tax haven lists have been highly political with no transparent criteria for inclusion. As a result, they have tended to identify the smallest jurisdictions, while ignoring the biggest players (Cobham, Janský & Meinzer, 2015). But the European Council published its criteria in advance, and so while their discussions in the Code of Conduct on Business Taxation group have remained typically opaque, it is possible to construct an assessment of which jurisdictions should be listed. We do this here, and provide the full dataset for each jurisdiction. We also go beyond the Council’s assessment in providing an evaluation of European Union member states on the same basis. In addition, we publish the full dataset openly so that others can make their own assessments.
In total, we identify 60 non-EU jurisdictions which fail to meet the criteria of which we think 41 should be listed, and an additional six EU member states: Cyprus, Ireland, Luxembourg, Malta, Netherlands and the United Kingdom. Full results are in Appendix Table A1.
Of the Council’s three criteria, two are based on OECD criteria. We do not list low and lower-middle income countries on those criteria alone, since these countries had no effective voice in OECD processes.
Another important flaw is that the second criterion is impossible to assess externally. By construction, it depends on data provided only to the Code of Conduct group. Our evaluation here is necessarily subjective (although robust to criticism, as we argue). If we exclude jurisdictions that are only blacklisted against this criterion, in order to take the most conservative position possible, our results indicate blacklisting for a minimum of 28 non-EU jurisdictions (47 fail to meet the other two criteria). Finally, we highlight a further weakness of the criteria. As they are drawn, it is possible for jurisdictions to avoid blacklisting by providing very little cooperation indeed – as, for example, the United States will manage. A more rigorous approach would yield criteria that are more meaningful both in protecting EU members and in driving policy improvement internationally.


Table of contents
Introduction
Profit shifting by multinational companies is estimated to impose global revenue losses each year of around $500 billion (Cobham & Janský, 2018) – with the most intense costs in lower-income countries. And the Paradise Papers have confirmed once again the extent to which jurisdictions around the world continue to engage in activities designed to attract profit shifting by multinationals.
Most striking perhaps were the revelations about the search for a new offshore structure for Apple, after it became clear that its Irish arrangement would be shut down. The law firm Baker McKenzie surveyed various local offices of the law firm Appleby, asking them to: “Confirm that an Irish company can conduct management activities (such as board meetings, signing of important contracts) without being subject to taxation in your jurisdiction” (Drucker & Bowers, 2017). Jersey ultimately emerged as the ‘winner’ of this race to the bottom, with the losers in effect being any jurisdiction where Apple managed as a result to declare disproportionately low taxable profits in relation to their real economic activity.
The G20/OECD Base Erosion and Profit Shifting (BEPS) project, which ran from 2013-2015, was intended to deliver a major reform of the international tax rules for multinational companies. The single aim of the BEPS Action Plan was clear: ‘The G20 finance ministers called on the OECD to develop an action plan to address BEPS issues in a co-ordinated and comprehensive manner. Specifically, this Action Plan should provide countries with domestic and international instruments that will better align rights to tax with economic activity’ (OECD, 2013 p.11, emphasis added).
The growing consensus that the BEPS project has failed to meet this ambition can be seen not only in the research and media revelations, but also in the policy stance of leading international powers. Although now set aside, the initial proposal for a major US tax reform involved a clean break completely with OECD tax rules and the adoption of a destination-based cashflow tax – a form of unitary taxation that largely eliminates the requirement for transfer pricing adjustments. The EU meanwhile has revived the long-standing proposal for a Common Consolidated Corporate Tax Base (CCCTB), which likewise would eliminate transfer pricing by recognising that profit arises at the unit of the multinational group, rather than in individual subsidiaries.
The other key plank of the EU approach to tackling profit shifting has been to turn the pressure on the jurisdictions that promote and benefit from it. This has included the state aid challenges to its own member states that preceded Apple’s Irish restructuring; but also the creation of a blacklist of ‘non-cooperative’ jurisdictions, to target profit shifting procurers outside the EU.
Historically, blacklists have been created by organisations such as the OECD and IMF, without transparent or objectively verifiable criteria (Tax Justice Network, 2015). That in turn has left them open to political pressure, and a consistent tendency to identify smaller, less politically well-connected jurisdictions and to omit major financial centres. As such, the G20’s creation in 2009 in London, of a list based on a minimum number of bilateral tax information exchange agreements was an important development. Although the criterion was so weak that the list was empty within days, the principle was established. The Tax Justice Network’s Financial Secrecy Index had been created for just this reason, to set objectively verifiable measures of the actual secrecy and potential global impact of jurisdictions, to set a level playing field against which progress could be judged, and so the G20 confirmation of the approach was significant.
The European Council will now bring forward a list concerned not with the wider financial secrecy that underpins offshore tax evasion and wider corruption including the hiding of criminal proceeds, but instead focused on the specific drivers of profit shifting – closer, for example, to the narrower assessment carried out by Oxfam’s Tax Battles study (2016) In keeping with the establishment of the principle that objectively verifiable criteria are necessary to ensure a fair and apolitical treatment of jurisdictions, the Council published details of the approach to be taken in advance of conducting investigations of the relevant jurisdictions.
There is, however, considerable concern over the European Council’s approach. This relates to three main issues:
-
Substantive basis. First, as the following sections will explore, the criteria depend largely on adherence to OECD standards. While this provides external validation that is useful to a point, it also has two problems. For one, it means that non-OECD countries – that is, most lower income countries – are being assessed on their adherence to standards in the design of which they had no meaningful voice. And two, the OECD’s standards are the result of political processes among their (rich country) members – and so often reflect the lowest common denominator for agreement, rather than a more intellectually rigorous or practically valuable analysis.
-
Objective verifiability. The second problem with the European Council’s criteria is that they are not fully objectively verifiable. In fact, the second of the three broad criteria rests entirely on a private assessment conducted by notoriously secretive Code of Conduct on Business Taxation group, using information provided only to this group. As such, external researchers cannot hope to replicate the approach.
-
Political limitations. Finally, the European Council’s approach suffers from obvious political limitations. The weaknesses of objective verifiability open the door to the same type of political manipulation that characterised earlier lists. Already, it has been leaked that the UK had blocked the notification of 12 out of 53 jurisdictions that they were at risk of blacklisting, relenting only when the launch of the Paradise Papers was imminent. But two bigger issues remain. First, the criteria are drawn in such a way that the United States will escape listing – at least for the first edition. Given the US’ refusal to cooperate with key financial transparency measures, and its position near the top of the Financial Secrecy Index, this is a difficult position to justify. Second, by design the blacklist does not consider EU member states – despite a number of them being commonly identified as among the biggest profit shifting jurisdictions globally. Analysis of US-headquartered multinationals, for which somewhat better data is publicly available, identifies Netherlands, Luxembourg and Ireland as key players here (Cobham & Janský, 2017) while studies with balance sheet data that is weighted towards European multinationals indicates a role for Austria and Belgium also (Cobham, Janský, & Loretz, 2017)
This report is laid out as follows. The next section sets out the first and third criteria of the European Council, which rest on adherence to OECD standards, and presents our findings for each. The following section presents the more uncertainly specified second criteria, our chosen approach and the results that follow. The subsequent section lays out the implications of applying the approach to EU member states, and a final section concludes with a summary of findings and a set of key questions for policymakers at the European Council and beyond.
1. Criteria 1 and 3
The blacklist is part of a wider EU tax reform process that included the Anti-Tax Avoidance Directive (ATAD), that implemented BEPS, and the proposals for public country-by-country reporting, and was included in the action plan on corporate taxation. It is a three step process composed of a scoreboard of indicators, a screening of third countries, and a recommendation by the Commission on which countries should be added (EU Parliament, 2017).
In September 2016, the Commission released its scoreboard of indicators which makes a preliminary analysis of third country jurisdictions to determine which should receive formal further screening. The scoreboard first selects countries based on their strength of economic ties with the EU, the level of (disproportional) financial activity and stability factors (corruption and regulatory quality). Then, the countries were ranked and screened for risk indicators that included participation in tax transparency agreements, supplying preferential tax measures and having no or a very low corporate tax rate or not corporate income tax at all. This resulted in a list of 92 countries that will be screened on selected criteria (see Appendix Table A2) (European Commission, 2016).
On first sight, it seems a promising list. It includes the usual suspects such as Switzerland and the Cayman Islands, and the EU has the audacity of screening fellow G20 members, including the USA which does not participate in the OECD Common Reporting Standard (CRS, the multilateral program for automatic exchange of information, AEoI) but does have its own, largely non-reciprocal Foreign Account Tax Compliance Act (FATCA) (Christians, 2013). However, there remains a lot of room for political interference and the rules of the first criterion seem specifically designed to ensure the US is not listed.
The three criteria are: tax transparency, fair taxation and anti-BEPS measures. We treat criteria 1 and 3 together for two reasons. First, they are similar in that they demand participation in, respectively, the OECD tax transparency initiatives and the implementation of OECD BEPS minimum standards. For criterion 3, simply pledging to implement the four BEPS minimum standards (on harmful tax practices, country-by-country reporting, treaty shopping, and dispute resolution) is enough in the short term since the peer review process is still in development. This criterion will be updated in the future to require a sufficient compliance rating by the BEPS inclusive Framework; but for now, signing up to the framework is enough to pass.
| Criterion 1 | |
|---|---|
| Criterion 1 | Tax transparency |
| Criterion 1.1 | Participate in the CRS. Future: have at least a largely compliant rating by the Global Forum on Automatic Exchange of Information |
| Criterion 1.2 | Largely compliant rating by the Global Forum with regards to information exchange upon request |
| Criterion 1.3 | Participate in MCMAA or have sufficient treaty network |
| Future criterion 1.4 | Criterion on Beneficial ownership registers |
| Criterion 3 | |
| Anti-BEPS measures | Commit to implement BEPS minimum standards |
| Future criterion | Dependent on BEPS implementation peer review ratings |
Criterion 1 is subdivided into three sub-criteria. The first is about commitment to the Common Reporting Standard AEoI program. At this point, having committed to implementation and having started the legislative process is enough to pass. In the future, the compliance rating the Global Forum - an organisation based at the OECD, but separate from it and with a wider membership, responsible for the peer reviews for the CRS – will be factored in. The second sub-criterion entails that a jurisdiction should possess at least a ‘largely compliant’ rating by the Global Forum with respect to the OECD Exchange of information on Request (EIoR) standard. The third sub criterion demands that jurisdictions either participate in the Multilateral convention on Mutual Administrative Assistance in Tax Matters – which is a multilateral convention on information exchange on request – or have a network of exchange agreements that is sufficiently broad to cover all EU member states. In the future, a fourth criterion regarding beneficial ownership will be included (Council of the European Union, 2016).
The first question that should be posed is: does the United States pass or fail the criterion on tax transparency? Not only is the United States the EU’s largest trading partner both in terms of foreign direct Investment (Hakelberg, 2016) and trade in goods and services (Eurostat, 2015), but some of its states - Delaware most famously, but many others including Nevada and Wyoming - compete to provide financial secrecy, and the USA is ranked third in the Financial Secrecy Index (Tax Justice Network, 2015). The US also does not participate in the OECD CRS. Instead, it has its own FATCA AEoI law, which came first. FATCA was enacted in 2010, and has a sanction mechanism. Banks that don’t share bank account information on US citizens with the US tax authorities face a 30% withholding tax on all bank transactions within the US. Because of the centrality of the dollar in the international banking system (Emmenegger, 2015), this means that there is very little chance of escaping FATCA.
However, the problem of FATCA is reciprocity. Although the US signed FATCA intergovernmental agreements with several countries (United States Treasury Department, 2017), mainly to circumvent problems with national legislation such as Switzerland’s banking secrecy laws breaches being criminal offences; the reciprocity clauses are very ambiguous about the US’s actual commitments (Christians, 2013). Indeed, the Obama administration proposed FATCA reciprocity measures in its budget proposals four years in a row, only to be turned down by Congress. There are no signals that the Trump administration will do anything to correct this imbalance.
From the EU’s perspective, this means that the US is basically the largest offshore centre that still does not automatically share information with the member states. Empirical evidence shows that there has been a significant rise in foreign bank deposits inflows in the United States, and that this is attributable to FATCA (Hakelberg & Schaub, 2017). A significant part of these foreign bank deposits are likely to be held by European Union citizens. There is a case to be made that the EU should blacklist the US, based on the deficiencies in FATCA, and its refusal to sign up to the CRS.
However, the wording in criterion 1 seems to be deliberately phrased in such a way that the US will never be on the list. Firstly, until 2019 an exception applies that a country passes criterion 1 if it fulfils two of the three sub criteria. This leaves the US safely off the list until then, since it fulfils criteria 1.2 and 1.3. Thereafter, it should fulfil all three criteria, but the first criterion changes to a peer review rating by the Global Forum on AEoI. This puts the decision out of the hands of the EU and into that of the OECD and the Global Forum. There is little reason to believe that the OECD would allow a member as important as the US be diplomatically shamed by giving it a non-compliant rating. The wording also refers to AEoI in general and not to the CRS specifically. The OECD also has a habit of including the US and FATCA in a footnote to explain its absence from lists such as the AEoI status of commitments (OECD, 2016). There is good reason to believe it will grant the US the threshold “largely compliant” rating or higher because of FATCA and that the US will not be listed in the future as well.
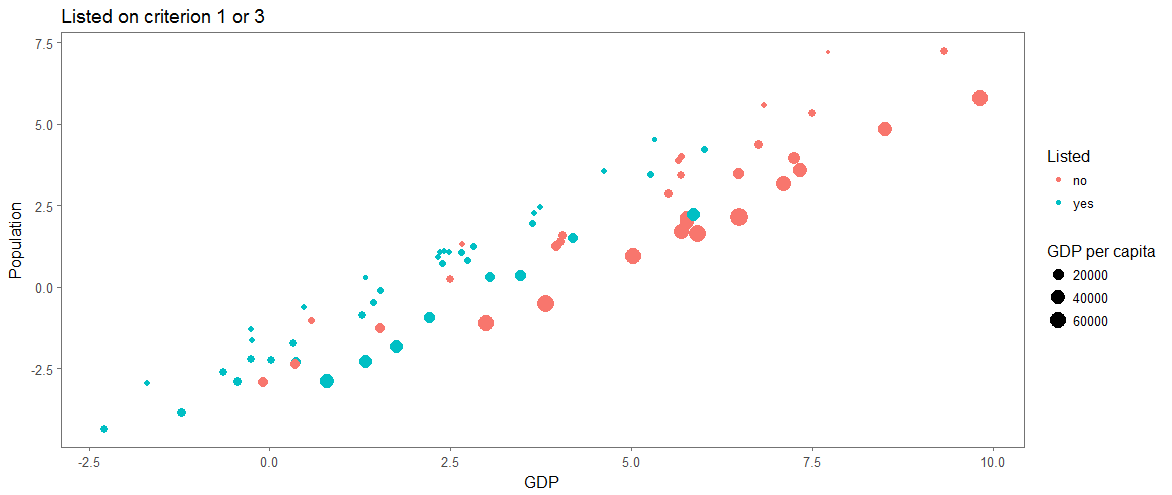
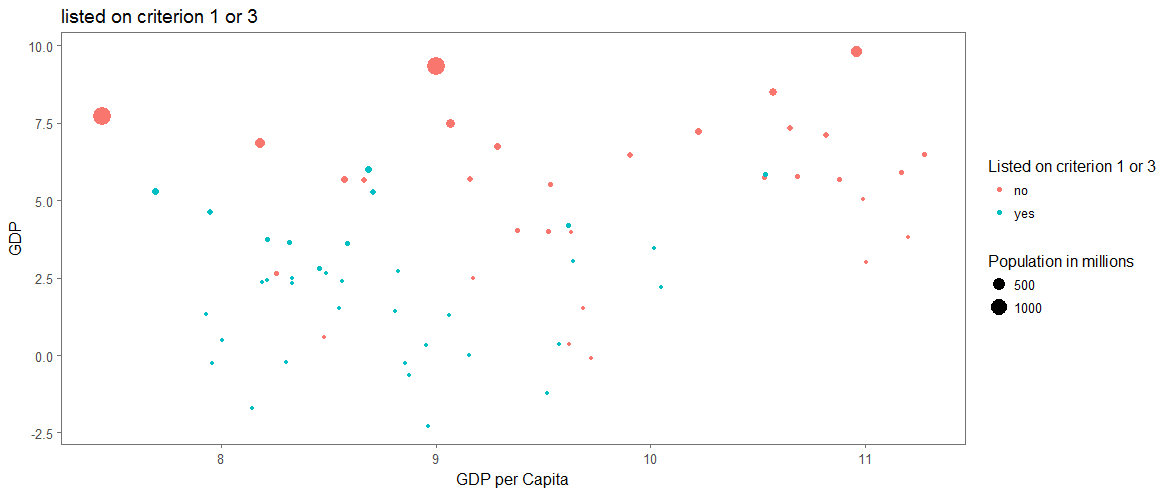
The countries that are listed based on a failure on either criterion 1 or 3 are generally, as shown in figure 1, lowly populated countries with a low GDP. Figure 2 shows that there is no relationship between GDP per capita of a country and being listed, and that GDP is the factor that is correlated with being put on the list. There are a few interpretations possible. One is that the OECD and the G20 managed to get the biggest economies that pose a risk of acting as offshore centres to comply with the new standards, which is a good thing.
An alternative explanation is that developing countries are being excluded from the OECD projects. The CRS for example has been criticised for denying developing countries the benefits by requiring reciprocity. Many developing countries don’t have the infrastructure to implement the CRS immediately (Eurodad, 2015). A transition period could have helped them. However, as it stands now, these countries might be listed not for refusal to sign up but merely for not having the resources to implement the needed infrastructure. All while they would arguably get the biggest marginal benefits by receiving automatic information on their own citizens. At the same time, criterion 3 compels developing countries to sign up to and implement changes to the international tax system in which they had little to say. Moreover, BEPS is based on the OECD-designed international tax rules and treaty network which are criticised for disadvantaging developing countries. Even to such an extent that the IMF cautioned developing countries to be very careful against signing such tax treaties (IMF, 2014).
As it stands now, the EU’s blacklist criteria 1 & 3 will exacerbate these injustices in global taxation, instead of ameliorating them. For that reason, we differentiate between two groups of jurisdictions: high-income countries, financial centres and upper middle-income countries that are members of the G20, OECD or EU member candidates; and low & lower-middle income countries, plus other upper-middle income countries. While we fully agree the first group should be listed for failure to comply, we put in question the fairness of listing the second group for failure on these criteria alone.
2. Criterion 2 - Fair taxation
Criterion two on fair taxation contains two sub-criteria. The first is that countries should have no preferential tax measures that could be regarded as harmful. This is specified as: third country jurisdictions should not have preferential tax measures that go against the EU Code of Conduct on Business Taxation (1997). The second sub-criterion is that the jurisdiction should not facilitate offshore structures or arrangements aimed at attracting profits which do not reflect real economic activity in the jurisdiction (Council of the European Union, 2016).
Both these criterions are problematic for several reasons. In only a few cases, it’s possible to design objectively verifiable assessments of the elements set out in the Code of Conduct, one example being: “Whether advantages are accorded only to non-residents or in respect of transactions carried out with non-residents”. Assessing these however would mean to assess - in theory at least - every tax measure of every jurisdiction. One would need enormous amounts of time and resources to do this, and the authors are not sure even the Code of Conduct group itself has these.
Other elements of the code of conduct are even harder to assess, because only subjective assessments can be made and objectively verifiable parameters are not possible. For example: element 3, ‘Whether advantages are granted even without any real economic activity and substantial economic presence within the Member State offering such tax advantages’ – who defines ‘real’ and ‘substantial’, and how? The subjectivity of making this assessment would mean that the Code of Conduct on Business Taxation Group could very well come to other criteria and thus diverging outcomes than the authors.
Criterion 2.2 is even more problematic to assess because the council makes it clear that the assessment will depend on information not available to other parties such as ourselves: ‘A jurisdiction should be deemed as non-compliant with criterion 2.2 if it refuses to engage in a meaningful dialogue or does not provide the information or explanations that the Code of Conduct Group may reasonably require or otherwise does not cooperate with the Code of Conduct Group where it needs to ascertain compliance of that jurisdiction with criterion 2.2 in the conduct of the screening process.’ This gives the (infamously opaque) Code of Conduct group the authority to assess whether a jurisdiction is compliant with this criterion without public accountability. Finally, while some of the potential indicators could be obtained from public or paid sources, such as the IBFD’s databases, in many cases sources of data containing the necessary level of detail and/or specificity of assessment implied by the criteria simply do not exist.
This obliges researchers to use proxy measurements to assess whether a jurisdiction is compliant with the fair taxation criterion according to the EU. There is a strong case to be made that the ultimate aim of this part of the blacklist is to establish whether or not a jurisdiction is practicing ‘fair taxation’ in respect of attempts to attract profits associated with real economic activity located elsewhere. Not coincidentally, this aligns powerfully with the single aim of the OECD BEPS process: to reduce the misalignment of profits and real activity.
One could attempt to construct such a proxy measure by examining jurisdictions economic indicators and identifying excesses in relation to the country’s economic size. One such approach is Jan Fichtner’s Offshore-intensity ratio which looks at stock data on international banking assets, portfolio investment and foreign direct investment in relation to GDP (Fichtner, 2015). The problem with such approaches is that even that quite general economic data is not always available for some of the jurisdictions on the EU’s list. Furthermore, aggregated national statistics are often subject to political preferences and influence (Garcia-Bernardo, Fichtner, Takes, & Heemskerk, 2017).
Instead of using an indicator-based identification approach, we used the novel approach of identifying offshore financial centres (OFCs) based on a country’s position in the network of global corporate ownership. This approach was developed by CORPNET and provides a credible, objective assessment – with sufficient global coverage – of the extent to which individual jurisdictions attract ‘excess’ profits. The researchers differentiate between OFC ‘conduits’ and ‘sinks’, which they define as follows:
-
Sink-OFCs are countries that attract and retain foreign capital–territories in this category are usually characterised as tax havens, such as the British Virgin Islands, the Cayman Islands and Bermuda. Most sink-OFCs have small domestic economies and large values of foreign assets, which are attracted through low or zero corporate taxes. Because of this disparity between the local economy and external assets, the aforementioned offshore-intensity ratio approach is well suited for identifying these sink-OFCs. Conduit-OFCs on the other hand are ‘countries that are widely perceived as attractive intermediate destinations in the routing of investments'.
-
Conduit-OFCs typically have low or zero taxes imposed on the transfer of capital to other countries, either via interest payments, royalties, dividends or profit repatriation. In addition, such jurisdictions have highly developed legal systems that are able to cater to the needs of multinational corporations. Conduits play a key role in the global corporate ownership network by allowing the transfer of capital without taxation. In this way, profit from one country can be re-invested in another part of the world paying no or little taxes. - (Garcia-Bernardo et al., 2017)
Since we believed that just attracting excess capital flows was not enough to be blacklisted and that a jurisdiction would have to have policies deliberately targeted at attracting these, we combined the CORPNET analysis with an extra condition. The jurisdiction either has to have no or a zero percent withholding tax on dividends (data from Deloitte), or a preferential tax regime (as identified by the EU commission). When these conditions are met, the jurisdiction is deemed uncompliant with the fair taxation criterion.
We deliberately did not include the corporate tax rate in our assessment, although a low or zero percent corporate tax rate is often seen as a quintessential feature of an offshore jurisdiction. We believe however this might exclude some jurisdictions who have a high nominal corporate tax rate, but where the effective tariff might be substantially lower. Saint Vincent and the Grenadines has a tax rate in the top 25 percent of the world bracket, but attracts as much excess capital as Hong Kong which sits at the bottom 25 percent.
We also include three extra indicators per jurisdictions, whether it has transfer pricing rules in place, thin capitalisation rules and controlled foreign company rules. The absence of such rules are major factors in the profit-shifting potential of a certain country. This might give the EU commission a starting point for recommendations to the listed jurisdictions.
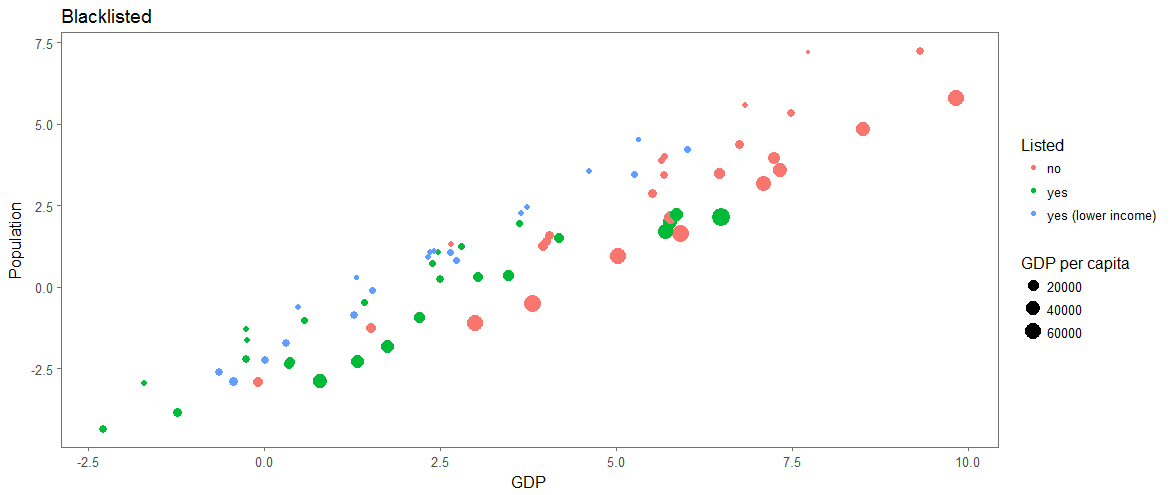
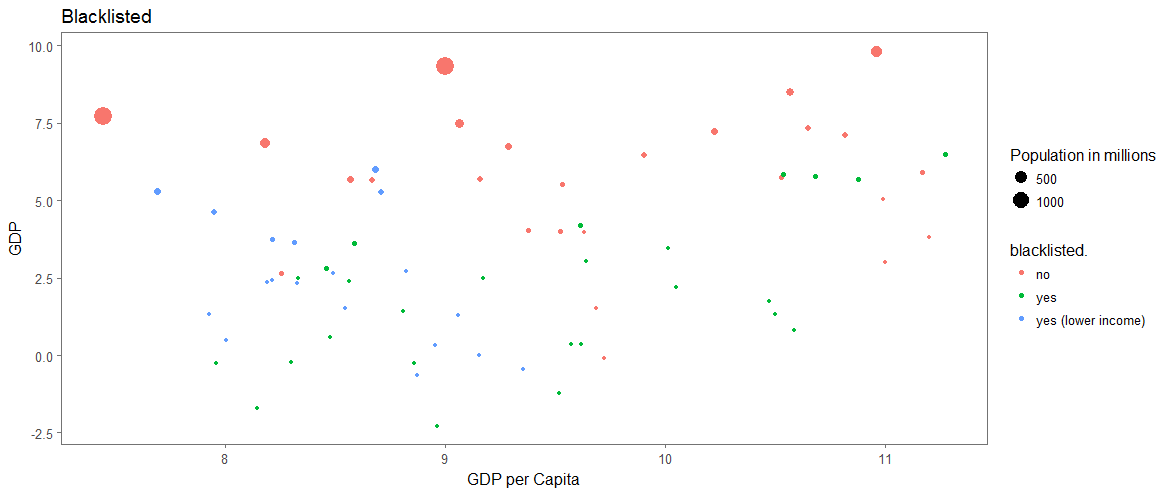
The following plots (figure 3 & 4) show how the inclusion of criterion 2 changes which countries are captured by the blacklist. The figures show that, while a couple more countries are listed, the pattern does not change. High-GDP countries tend to escape while lower-GDP countries are blacklisted. Again, GDP per capita shows no correlation to being blacklisted or not. This again has the ambiguous meaning that the OECD and G20 have managed to include most important financial centres in the CRS and BEPS, but that developing countries tend to be left out of these important initiatives in an area where they could use assistance from developed countries.
3. EU member states
We also have to wonder whether the EU countries themselves would make the list? This is important since hypocrisy on this front tends to turn against the blacklisting power. When the OECD released its blacklist on harmful tax practices in 2000, it listed many non-member offshore centres but failed to include the likes of Switzerland and Luxembourg who at the time clearly fitted the criteria. This was met with a justifiable backlash from those listed, who used the OECD’s talk of level playing fields for fair taxation against it in what Sharman dubbed: “rhetorical entrapment” (Sharman, 2006).
Now, the EU implemented the CRS by means of the enhanced directive on administrative cooperation in taxation matters (European Commission, 2015), and the BEPS measures with the Anti-Tax Avoidance I and II directives. This means that all EU member states are compliant with criteria 1 and 3.
However, Luxembourg, Cyprus and Malta are named as sinks in the CORPNET results, while Netherlands, United Kingdom, and Ireland are considered conduits (Garcia-Bernardo, Fichtner, Takes, & Heemskerk, 2017). Moreover, a significant number of the listed sink jurisdictions are tied to the UK either as Crown Dependencies or Overseas Territories. The EU might consider this when publishing its blacklist; while the progress of Brexit may also have interesting implications for the bloc’s treatment of the UK itself.
4. Conclusion
The EU blacklist could be a tool for forwarding global tax justice, since credible sanction threats by great economic powers can force offshore jurisdictions to cooperate on tax matters (Hakelberg, 2016). However, the process of the EU blacklist seems too deeply flawed to achieve these goals.
By having two criteria explicitly be determined by the OECD CRS and BEPS projects, the blacklist will include the same shortcomings to global tax justice as those processes. First of all, this is likely to result in the exclusion of many lower-income countries both from the input and output of the projects. Second, the OECD is a members club – and just as the EU has decided not to include its own members for equal treatment, so too the OECD struggles to treat its own fairly. By not including the US and phrasing the criteria in such a way that the US is unambiguously excluded from the blacklist, the EU fails to condemn the largest offender to global tax transparency. The EU is likely the only entity that has the necessary economic leverage to compel the US to adopt full AEoI reciprocity, and the US is very aware of that fact. Recent examples of this phenomenon are the tax ruling cases which were aimed at large US tech companies, sparking what some saw as a looming tax war between the two (Jopson & Oliver, 2016).
Thirdly, the second criterion on fair taxation is deliberately vague and leaves a lot of room for either subjective assessments and/or backroom politics. By explicitly authorising the notoriously secretive EU code of conduct group to assess not only whether a jurisdiction qualifies but also if it has cooperated adequately with them, the assessment of criterion two becomes an unaccountable process. This leaves the door wide open for backroom politics and the exclusion of jurisdictions that should be listed in the name of diplomatic interests (although on the upside, Brexit might mean that the UK will not be in the position to object against its Overseas Territories or Crown Dependencies being listed). It also prevents independent researchers from verifying the listing process objectively.
We await release of the final blacklist to see how much of these doubts about the process are founded, and if the EU lets the blacklist be dictated by diplomatic or economic interest rather than the aim of effective taxation, or tax justice. However, past experience teaches that blacklist are often vain attempts, and the wording of the specific EU criteria suggest that this time may be little different. Only when states agree on a comprehensive, transparent and objectively verifiable criteria – such as those in the Financial Secrecy Index – will there be a meaningful list which could validly be used as the basis for economic counter-measures.
An international convention to agree the minimum standards of financial transparency, including with respect to profit shifting, could provide the best way to set legitimate criteria and to ensure the eventual benefits are enjoyed by all. International negotiations with G77 and G20 participation, ideally through the UN system, could confirm three emerging standards as the basis for criteria:
-
A. Full, multilateral automatic exchange of tax information (with fixed-term reciprocity waivers for lower-income countries);
-
B. Public registers of beneficial ownership for companies, trusts and foundations; and
-
C. Public country-by-country reporting by multinationals, with jurisdictions committing to reduce the revealed profit misalignment.
Such a convention, with standards agreed and owned by all participants, could set the basis for legitimate blacklisting of those would deny the benefits of globalisation to others – and for meaningful counter-measures.
The EU blacklist, in contrast, will rest on criteria agreed only by one group of powerful countries; whose evaluation cannot be fully verified objectively; and which are then applied to others but not to themselves.
Bibliography
-
Berkhout, E. (2016). Tax Battles: the dangerous global race to the bottom on corporate tax. Oxfam International.
-
Christians, A. (2013). What You Give and What You Get : Reciprocity under a Model 1 Intergovernmental Agreement on FATCA. Cayman Financial Review, (April 2013), 1–8.
-
Cobham, A., & Janský, P. (2017). Measuring Misalignment: The Location of US Multinationals’ Economic Activity versus the Location of their Profits. Development Policy Review.
-
Cobham, A., & Janský, P. (2018). Global Distribution of Revenue Loss from Tax Avoidance: Re-estimation and Country Results. Journal of International Development, Forthcoming.
-
Cobham, A., Janský, P., & Loretz, S. (2017). Key Findings from Global Analyses of Multinational Profit Misalignment. In S. Picciotto (Ed.), Taxing Multinational Enterprises as Unitary Firms (pp. 100–118). Brighton: ICTD.
-
Cobham, A., Jansky, P. & Meinzer, M.(2015). The financial secrecy index: shedding new light on the geography of secrecy, Economic Geography 91(3): 281–303.
-
Council of the European Union. (2016). Council Conclusions on the criteria for and process leading to the establishment of the EU list of non- cooperative jurisdictions for tax purposes.
-
Drucker, J., & Bowers, S. (2017, November 6). After a Tax Crackdown, Apple Found a New Shelter for Its Profits. New York Times. New York. Retrieved from https://www.nytimes.com/2017/11/06/world/apple-taxes-jersey.html
-
Emmenegger, P. (2015). The long arm of justice : U . S . structural power and international banking. Bussiness and Politics, 17(3), 473–493. http://doi.org/10.1515/bap-2014-0046
-
EU Parliament. (2017). COMMON EU LIST OF NON-COOPERATIVE JURISDICTIONS. Legislative Train Schedule. Retrieved September 7, 2017, from http://www.europarl.europa.eu/legislative-train/theme-deeper-and-fairer-internal-market-with-a-strengthened-industrial-base-taxation/file-common-eu-list-of-non-cooperative-jurisdictions
-
Eurodad. (2015). Information for the nations.
-
European Commission. (2015). Enhanced administrative cooperation in the field of (direct) taxation. Retrieved November 20, 2015, from http://ec.europa.eu/taxation_customs/taxation/tax_cooperation/mutual_assistance/direct_tax_directive/index_en.htm
-
European Commission. (2016). First step towards a new EU list of third country jurisdictions: Scoreboard. Retrieved September 7, 2017, from https://ec.europa.eu/taxation_customs/sites/taxation/files/2016-09-15_scoreboard-indicators.pdf
-
Eurostat. (2015). USA-EU - international trade and investment statistics. Retrieved from http://ec.europa.eu/eurostat/statistics-explained/index.php/USA-EU_-_international_trade_and_investment_statistics
-
Fichtner, J. (2015). The Offshore-Intensity Ratio Identifying the Strongest Magnets for Foreign Capital. CITYPERC Working Paper, 18
-
Garcia-Bernardo, J., Fichtner, J., Takes, F. W., & Heemskerk, E. M. (2017). Uncovering Offshore Financial Centers : Conduits and Sinks in the Global Corporate Ownership Network. Scientific Reports, (June), 1–10. http://doi.org/10.1038/s41598-017-06322-9
-
Hakelberg, L. (2016). Coercion in international tax cooperation: identifying the prerequisites for sanction threats by a great power. Review of International Political Economy, 2290(January), 1–31. http://doi.org/10.1080/09692290.2015.1127269
-
Hakelberg, L., & Schaub, M. (2017). The redistributive impact of hypocrisy in international taxation. Regulation & Governance, (March). http://doi.org/10.1111/rego.12156
-
IMF. (2014). Spillovers in international corporate taxation. IMF Policy Paper. Retrieved from http://www.imf.org/external/np/pp/eng/2014/050914.pdf
-
Jopson, B., & Oliver, C. (2016). US lawmakers slam “hostile” EU tax climate. Financial Times. Retrieved from https://next.ft.com/content/a40e4b34-c9c7-11e5-be0b-b7ece4e953a0
-
OECD. (2013). OECD Action Plan on Base Erosion and Profit Shifting. http://doi.org/10.1787/9789264202719-en
-
OECD. (2016). AEOI : status of commitments (as at 26 July 2016).
-
Sharman, J. C. (2006). Havens in a storm. The struggle for global tax regulation. Ithaca: Cornell University Press.
-
Tax Justice Network. (2015). Financial Secrecy index. Retrieved June 14, 2016, from http://www.financialsecrecyindex.com
-
United States Treasury Department. (2017). FATCA recourse center. Retrieved February 10, 2017, from http://www.treasury.gov/resource-center/tax-policy/treaties/Pages/FATCA.aspx
Appendix
Table A1: Final Blacklist
X* indicates a country that fails criterion one or three but is either:
- • A low or lower middle-income country that is not considered a financial centre
- • An upper middle-income country that is not a member of the G20 or the OECD, not an EU member state or candidate and not a financial centre.
| Jurisdiction | Blacklisted? | Passes Criterion Tax Transparency | Passes Criterion Fair Taxation | Passes Criterion Anti Beps | Listed solely on criterion two | Income level | OECD member, G20 member, EU candidate or Financial Centre? | |
|---|---|---|---|---|---|---|---|---|
| 1 | Albania | X | X | X | upper middle | X | ||
| 2 | American Samoa | x* | X | upper middle | ||||
| 3 | Anguilla | X | X | |||||
| 4 | Antigua and Barbuda | X | X | high | ||||
| 5 | Armenia | x* | X | lower middle | ||||
| 6 | Aruba | X | X | X | high | |||
| 7 | Australia | X | X | X | high | X | ||
| 8 | Bahamas | X | X | high | ||||
| 9 | Bahrain | X | X | X | high | |||
| 10 | Barbados | X | X | X | high | |||
| 11 | Belize | X | X | X | X | upper middle | ||
| 12 | Bermuda | X | X | X | X | high | ||
| 13 | Bosnia and Herzegovina | X | X | upper middle | X | |||
| 14 | Botswana | x* | X | X | upper middle | |||
| 15 | Brazil | X | X | X | upper middle | X | ||
| 16 | British Virgin Islands | X | X | X | X | high | ||
| 17 | Cabo Verde | x* | X | lower middle | ||||
| 18 | Canada | X | X | X | high | X | ||
| 19 | Cayman Islands | X | X | X | X | high | ||
| 20 | Chile | X | X | X | high | X | ||
| 21 | China | X | X | X | upper middle | X | ||
| 22 | Hong Kong | X | X | X | X | high | ||
| 23 | Macao | X | X | X | high | |||
| 24 | Colombia | X | X | X | upper middle | |||
| 25 | Cook Islands | X | X | X | ||||
| 26 | Costa Rica | X | X | X | upper middle | |||
| 27 | Curaçao | X | X | X | X | high | ||
| 28 | Dominica | x* | X | X | upper middle | |||
| 29 | Faroe Islands | X | X | X | high | |||
| 30 | Fiji | x* | X | upper middle | ||||
| 31 | Former Yugoslav Republic of Macedonia | X | X | upper middle | X | |||
| 32 | Georgia | X | X | X | lower middle | |||
| 33 | Gibraltar | X | X | high | ||||
| 34 | Greenland | X | X | X | high | |||
| 35 | Grenada | x* | X | X | upper middle | |||
| 36 | Guam | X | X | high | ||||
| 37 | Guernsey | X | X | X | high | |||
| 38 | Iceland | X | X | X | high | X | ||
| 39 | India | X | X | X | lower middle | X | ||
| 40 | Indonesia | X | X | X | lower middle | X | ||
| 41 | Isle of Man | X | X | X | high | |||
| 42 | Israel | X | X | X | high | X | ||
| 43 | Jamaica | x* | X | X | upper middle | |||
| 44 | Japan | X | X | X | high | X | ||
| 45 | Jersey | X | X | X | X | high | ||
| 46 | Jordan | x* | X | lower middle | ||||
| 47 | Korea | X | X | X | high | X | ||
| 48 | Malaysia | X | X | X | upper middle | X | ||
| 49 | Maldives | x* | X | X | upper middle | |||
| 50 | Mauritius | X | X | X | X | upper middle | ||
| 51 | Mongolia | x* | X | lower middle | ||||
| 52 | Montenegro | X | X | upper middle | X | |||
| 53 | Montserrat | X | X | X | ||||
| 54 | Morocco | x* | X | X | lower middle | |||
| 55 | Namibia | x* | X | upper middle | ||||
| 56 | New Caledonia | X | X | high | ||||
| 57 | Norway | X | X | X | high | X | ||
| 58 | Oman | X | X | X | high | |||
| 59 | Panama | X | X | X | upper middle | X | ||
| 60 | Peru | x* | X | X | upper middle | |||
| 61 | Qatar | X | X | X | high | |||
| 62 | Saint Kitts and Nevis | X | X | X | high | |||
| 63 | Saint Lucia | x* | X | X | upper middle | |||
| 64 | Saint Vincent and the Grenadines | X | X | upper middle | ||||
| 65 | Samoa | X | X | upper middle | ||||
| 66 | Saudi Arabia | X | X | X | high | X | ||
| 67 | Serbia | X | X | upper middle | X | |||
| 68 | Seychelles | X | X | X | X | high | ||
| 69 | Singapore | X | X | X | X | high | ||
| 70 | South Africa | X | X | X | upper middle | |||
| 71 | Swaziland | x* | X | lower middle | ||||
| 72 | Taiwan | X | high | |||||
| 73 | Thailand | x* | X | X | upper middle | |||
| 74 | Trinidad and Tobago | X | X | X | high | |||
| 75 | Tunisia | x* | X | X | lower middle | |||
| 76 | Turkey | X | X | X | upper middle | X | ||
| 77 | Turks and Caicos Islands | X | X | X | high | |||
| 78 | United Arab Emirates | X | X | X | high | |||
| 79 | United States | X | X | X | high | X | ||
| 80 | Uruguay | X | X | X | high | |||
| 81 | US Virgin Islands | X | X | high | ||||
| 82 | Viet Nam | x* | X | X | lower middle | |||
| 83 | Andorra | X | X | X | high | |||
| 84 | Liechtenstein | X | X | X | X | high | ||
| 85 | Monaco | X | X | X | X | high | ||
| 86 | San Mari | X | X | X | high | |||
| 87 | Switzerland | X | X | X | X | high | X | |
| 88 | Marshall Islands | X | X | upper middle | X | |||
| 89 | Nauru | X | X | upper middle | X | |||
| 90 | Niue | X | X | X | X | |||
| 91 | Palau | X | X | high | ||||
| 92 | Vanuatu | X | X | lower middle | X | |||
| 93 | Austria | X | X | X | high | X | ||
| 94 | Belgium | X | X | X | high | X | ||
| 95 | Bulgaria | X | X | X | upper middle | |||
| 96 | Croatia | X | X | X | upper middle | |||
| 97 | Cyprus | X | X | X | X | high | ||
| 98 | Czech Republic | X | X | X | high | X | ||
| 99 | Denmark | X | X | X | high | X | ||
| 100 | Estonia | X | X | X | high | X | ||
| 101 | Finland | X | X | X | high | X | ||
| 102 | France | X | X | X | high | X | ||
| 103 | Germany | X | X | X | high | X | ||
| 104 | Greece | X | X | X | high | X | ||
| 105 | Hungary | X | X | X | high | X | ||
| 106 | Ireland | X | X | X | X | high | X | |
| 107 | Italy | X | X | X | high | X | ||
| 108 | Latvia | X | X | X | high | X | ||
| 109 | Lithuania | X | X | X | high | |||
| 110 | Luxembourg | X | X | X | X | high | X | |
| 111 | Malta | X | X | X | X | high | ||
| 112 | Netherlands | X | X | X | X | high | X | |
| 113 | Poland | X | X | X | high | X | ||
| 114 | Portugal | X | X | X | high | X | ||
| 115 | Romania | X | X | X | upper middle | |||
| 116 | Slovak Republic | X | X | X | high | X | ||
| 117 | Slovenia | X | X | X | high | X | ||
| 118 | Spain | X | X | X | high | X | ||
| 119 | Sweden | X | X | X | high | X | ||
| 120 | United Kingdom | X | X | X | X | high | X |
Appendix Table A2: Screening list and basic statistics (source: EU Commission, World Bank)
NA = Not available
| Jurisdiction | Population (millions) | GDP ($ billions) | GDP per Capita ($) | |
|---|---|---|---|---|
| 1 | Albania | 2.88 | 11.93 | 4146.90 |
| 2 | American Samoa | 0.06 | NA | NA |
| 3 | Anguilla | NA | NA | NA |
| 4 | Antigua and Barbuda | 0.10 | 1.45 | 14353.38 |
| 5 | Armenia | 2.92 | 10.55 | 3606.15 |
| 6 | Aruba | 0.10 | NA | NA |
| 7 | Australia | 24.13 | 1204.62 | 49927.82 |
| 8 | Bahamas | 0.39 | 9.05 | 23124.39 |
| 9 | Bahrain | 1.43 | 31.86 | 22354.17 |
| 10 | Barbados | 0.28 | 4.59 | 16096.89 |
| 11 | Belize | 0.37 | 1.77 | 4810.57 |
| 12 | Bermuda | 0.07 | NA | NA |
| 13 | Bosnia and Herzegovina | 3.52 | 16.56 | 4708.72 |
| 14 | Botswana | 2.25 | 15.27 | 6788.04 |
| 15 | Brazil | 207.65 | 1796.19 | 8649.95 |
| 16 | British Virgin Islands | 0.03 | NA | NA |
| 17 | Cabo Verde | 0.54 | 1.62 | 2997.75 |
| 18 | Canada | 36.29 | 1529.76 | 42157.93 |
| 19 | Cayman Islands | 0.06 | NA | NA |
| 20 | Chile | 17.91 | 247.03 | 13792.93 |
| 21 | China | 1378.66 | 11199.15 | 8123.18 |
| 22 | Hong Kong | 7.35 | 320.91 | 43681.14 |
| 23 | Macao | 0.61 | 44.80 | 73186.96 |
| 24 | Colombia | 48.65 | 282.46 | 5805.61 |
| 25 | Cook Islands | NA | NA | NA |
| 26 | Costa Rica | 4.86 | 57.44 | 11824.64 |
| 27 | Curaçao | 0.16 | NA | NA |
| 28 | Dominica | 0.07 | 0.53 | 7144.45 |
| 29 | Faroe Islands | 0.05 | NA | NA |
| 30 | Fiji | 0.90 | 4.63 | 5153.35 |
| 31 | Former Yugoslav Republic of Macedonia | 2.08 | 10.90 | 5237.15 |
| 32 | Georgia | 3.72 | 14.33 | 3853.65 |
| 33 | Gibraltar | 0.03 | NA | NA |
| 34 | Greenland | 0.06 | NA | NA |
| 35 | Grenada | 0.11 | 1.02 | 9469.22 |
| 36 | Guam | 0.16 | NA | NA |
| 37 | Guernsey | NA | NA | NA |
| 38 | Iceland | 0.33 | 20.05 | 59976.94 |
| 39 | India | 1324.17 | 2263.52 | 1709.39 |
| 40 | Indonesia | 261.12 | 932.26 | 3570.29 |
| 41 | Isle of Man | 0.08 | NA | NA |
| 42 | Israel | 8.55 | 318.74 | 37292.61 |
| 43 | Jamaica | 2.88 | 14.03 | 4868.25 |
| 44 | Japan | 126.99 | 4939.38 | 38894.47 |
| 45 | Jersey | NA | NA | NA |
| 46 | Jordan | 9.46 | 38.65 | 4087.94 |
| 47 | Korea | 51.25 | 1411.25 | 27538.81 |
| 48 | Malaysia | 31.19 | 296.36 | 9502.57 |
| 49 | Maldives | 0.42 | 3.59 | 8601.63 |
| 50 | Mauritius | 1.26 | 12.16 | 9627.60 |
| 51 | Mongolia | 3.03 | 11.16 | 3686.45 |
| 52 | Montenegro | 0.62 | 4.17 | 6701.00 |
| 53 | Montserrat | NA | NA | NA |
| 54 | Morocco | 35.28 | 101.44 | 2832.43 |
| 55 | Namibia | 2.48 | 10.27 | 4140.46 |
| 56 | New Caledonia | 0.28 | NA | NA |
| 57 | Norway | 5.23 | 370.56 | 70812.48 |
| 58 | Oman | 4.42 | 66.29 | 14982.36 |
| 59 | Panama | 4.03 | 55.19 | 13680.24 |
| 60 | Peru | 31.77 | 192.09 | 6045.65 |
| 61 | Qatar | 2.57 | 152.47 | 59330.86 |
| 62 | Saint Kitts and Nevis | 0.05 | 0.92 | 16725.28 |
| 63 | Saint Lucia | 0.18 | 1.38 | 7744.45 |
| 64 | Saint Vincent and the Grenadines | 0.11 | 0.77 | 7030.06 |
| 65 | Samoa | 0.20 | 0.79 | 4027.76 |
| 66 | Saudi Arabia | 32.28 | 646.44 | 20028.65 |
| 67 | Serbia | 7.06 | 37.75 | 5348.29 |
| 68 | Seychelles | 0.09 | 1.43 | 15075.72 |
| 69 | Singapore | 5.61 | 296.97 | 52960.71 |
| 70 | South Africa | 55.91 | 294.84 | 5273.59 |
| 71 | Swaziland | 1.34 | 3.73 | 2775.15 |
| 72 | Taiwan | NA | NA | NA |
| 73 | Thailand | 68.86 | 406.84 | 5907.91 |
| 74 | Trinidad and Tobago | 1.36 | 20.99 | 15377.10 |
| 75 | Tunisia | 11.40 | 42.06 | 3688.65 |
| 76 | Turkey | 79.51 | 857.75 | 10787.61 |
| 77 | Turks and Caicos Islands | 0.03 | NA | NA |
| 78 | United Arab Emirates | 9.27 | 348.74 | 37622.21 |
| 79 | United States | 323.13 | 18569.10 | 57466.79 |
| 80 | Uruguay | 3.44 | 52.42 | 15220.57 |
| 81 | US Virgin Islands | 0.10 | NA | NA |
| 82 | Viet Nam | 92.70 | 202.62 | 2185.69 |
| 83 | Andorra | 0.08 | NA | NA |
| 84 | Liechtenstein | 0.04 | NA | NA |
| 85 | Monaco | 0.04 | NA | NA |
| 86 | San Marino | 0.03 | NA | NA |
| 87 | Switzerland | 8.37 | 659.83 | 78812.65 |
| 88 | Marshall Islands | 0.05 | 0.18 | 3448.54 |
| 89 | Nauru | 0.01 | 0.10 | 7821.30 |
| 90 | Niue | NA | NA | NA |
| 91 | Palau | 0.02 | 0.29 | 13626.01 |
| 92 | Vanuatu | 0.27 | 0.77 | 2860.57 |
| 93 | Austria | 8.75 | 386.43 | 44176.52 |
| 94 | Belgium | 11.35 | 466.37 | 41096.16 |
| 95 | Bulgaria | 7.13 | 52.40 | 7350.80 |
| 96 | Croatia | 4.17 | 50.43 | 12090.67 |
| 97 | Cyprus | 1.17 | 19.80 | 23324.20 |
| 98 | Czech Republic | 10.56 | 192.92 | 18266.55 |
| 99 | Denmark | 5.73 | 306.14 | 53417.66 |
| 100 | Estonia | 1.32 | 23.14 | 17574.69 |
| 101 | Finland | 5.50 | 236.78 | 43090.25 |
| 102 | France | 66.90 | 2465.45 | 36854.97 |
| 103 | Germany | 82.67 | 3466.76 | 41936.06 |
| 104 | Greece | 10.75 | 194.56 | 18103.97 |
| 105 | Hungary | 9.82 | 124.34 | 12664.85 |
| 106 | Ireland | 4.77 | 294.05 | 61606.48 |
| 107 | Italy | 60.60 | 1849.97 | 30527.27 |
| 108 | Latvia | 1.96 | 27.68 | 14118.06 |
| 109 | Lithuania | 2.87 | 42.74 | 14879.68 |
| 110 | Luxembourg | 0.58 | 59.95 | 102831.32 |
| 111 | Malta | 0.44 | 10.95 | 25058.17 |
| 112 | Netherlands | 17.02 | 770.85 | 45294.78 |
| 113 | Poland | 37.95 | 469.51 | 12372.42 |
| 114 | Portugal | 10.32 | 204.56 | 19813.31 |
| 115 | Romania | 19.71 | 186.69 | 9474.13 |
| 116 | Slovak Republic | 5.43 | 89.55 | 16495.99 |
| 117 | Slovenia | 2.06 | 43.99 | 21304.57 |
| 118 | Spain | 46.44 | 1232.09 | 26528.49 |
| 119 | Sweden | 9.90 | 511.00 | 51599.87 |
| 120 | United Kingdom | 65.64 | 2618.89 | 39899.39 |
Data
We have published the data used for this report using Datahub. DataHub is the fastest way for individuals and teams to find, share and publish high quality data online. Follow the instructions on any of the following datasets to import the data into your tool using R, Pandas, Python, Javascript or Ruby. R users can also download further .r and .rmd files via Github.
Final blacklist
-
Final blacklist - CSV / JSON / XLS
-
EU blacklist - CSV / JSON / XLS
Outcomes
-
Blacklist(with X'ex) - CSV / JSON
-
Country data WB - CSV / JSON
-
Criterium Anti BEPS - CSV / JSON
-
Criterium Anti BEPS-EU - CSV / JSON
-
Criterium Anti BEPS-EU (with X'es) - CSV / JSON
-
Criterium Anti BEPS (with X'es) - CSV / JSON
-
Criterium Fair Taxation - CSV / JSON
-
Criterium Fair Taxation-EU - CSV / JSON
-
Criterium Fair Taxation-EU (with X'es) - CSV / JSON
-
Criterium Fair Taxation (with X'es) - CSV / JSON
-
Criterium Tax Transparency - CSV / JSON
-
Criterium Tax Transparency (with X'es) - CSV / JSON
-
Criterium Tax Transparency-EU - CSV / JSON
-
Criterium Tax Transparency-EU (with X'es) - CSV / JSON
-
EU blacklist (With X'ex) - CSV / JSON
-
EU country data WB - CSV / JSON
Raw data
-
Conduit-OFCs - CSV / JSON
-
Corporate tax rates - CSV / JSON
-
Countries - CSV / JSON
-
DTTL tax withholding tax rates - CSV / JSON
-
Indicators - CSV / JSON
-
Indicators EU - CSV / JSON
-
Income level - CSV / JSON
-
International members - CSV / JSON
-
List of EU countries - CSV / JSON
-
Preferential regimes - CSV / JSON
-
Sinks - CSV / JSON
-
Status of Agreements 2017 - CSV / JSON
Data sources per indicator
Criterion 1
- MCAA Signatory: https://www.oecd.org/ctp/exchange-of-tax-information/MCAA-Signatories.pdf
- CRS by MCAA or Bilateral: http://www.oecd.org/tax/automatic-exchange/international-framework-for-the-crs/exchange-relationships/#d.en.345426
- Number of exchanges: http://www.oecd.org/tax/automatic-exchange/international-framework-for-the-crs/exchange-relationships/#d.en.345426
- Global Forum Rating: http://www.oecd.org/tax/transparency/exchange-of-information-on-request/ratings/
- Global Forum Schedule: https://www.oecd.org/tax/transparency/about-the-global-forum/publications/schedule-of-reviews.pdf
- Multilateral Convention Signatory: http://www.oecd.org/tax/exchange-of-tax-information/Status_of_convention.pdf
- Tax Agreements: http://eoi-tax.org/jurisdictions/#default
Criterion 2
- Sink or Conduit?: https://www.ofcmeter.org
- Withholding Tax Rate on dividends: https://www2.deloitte.com
- Preferential tax regime: https://ec.europa.eu
- Corporate Tax Rate: https://home.kpmg.com
- TP Rules, Thin Cap rules, CFC rules: http://taxsummaries.pwc.com
Criterion 3
- Member of inclusive Framework on BEPS: http://www.oecd.org/tax/beps/inclusive-framework-on-beps-composition.pdf
- Inclusive Framework Signatories: http://www.oecd.org/tax/treaties/beps-mli-signatories-and-parties.pdf
- ATAD implementation: depends on EU membership.